The effect of the Covid-19 pandemic on human well-being
So here, we are, trapped in a lockdown due to the worst pandemic of the last 100 years. But is it actually a human tragedy? Or are people better at coping with the pandemic than one might think? What, in other words, is the impact of the pandemic on human well-being?
So far, we could only guess the answer, but for the first time, we can calculate it. The British “Understanding Society” panel asked people from April 24-30 about their mental well-being. This allows to show for the first time how the Covid-19 pandemic influenced the well-being of normal citizens. Let us start by having a look at the chance of reporting higher than usual mental problems.
Effect of the pandemic on mental problems
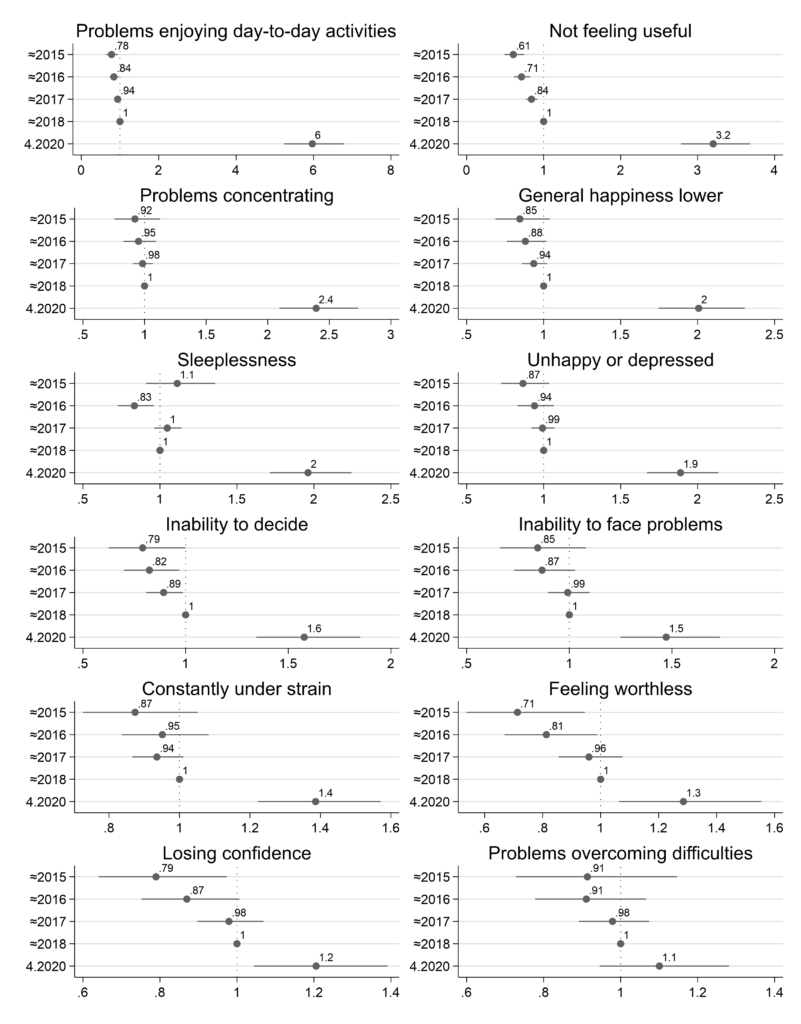
The following Figure 1 shows the chance of someone reporting different mental problems “rather more” or “much more” compared to “no more” than usual or “not at all.” I show the odds of reporting higher problems of the same person during the pandemic compared to 2018. Data for the year 2019 is not yet available, because the Understanding Society panel has provided the 2020 Covid-19 data unusually early, it usually takes about two years from data gathering to data provision for researchers.
Odds ratios are therefore relative to the base year of wave 9 of Understanding Society, which took place around 2018 (mostly in 2017, largely in 2018 and slightly in 2019). Relative to this, the odds ratios show the chance of reporting a mental problem in April 2020 for the same person. For comparison purposes, I also show the chance that a person reports the same problem in years before 2018. Note that all calculations are based on fixed effects regressions, so they show differences for the same person. Note that an odds-ratio of 1 means that exposure to the pandemic does not affect the odds of mental problems. So, for example, the value of 6 in the first graph means that the same person had 6-times higher odds to report having problems enjoying day-to-day activities during the pandemic from April 24.-30.2020, compared to the preceding wave that took place between 2017 and 2019 (around 2018). The regressions only control for age and age-squared, to make sure increasing mental problems are not a result of people’s natural aging process. All persons are weighted with their last cross-sectional weight, which should make the main effects broadly representative of changes in the health status of the UK population in 2020.

Figure 1: Odds to report increased mental problems during Covid-19 pandemic (24.-30.4.2020) in the UK, relative to previous years (fixed effects regression of the same person, adjusted for general changes in age and weighted with each person’s last individual weight)
During the Covid-19 pandemic, the odds that the same person reports “rather more” or “much more” difficulty enjoying day-to-day-activities are 6-times of what they were during the preceding year. By the same measure, feelings of uselessness have multiplied by 3.2, the odds of having problems concentrating are 2.4-times of what they were the previous year. The chance to report problems lower general happiness have doubled, and so have problems with sleeplessness as well as unhappiness and depression.
The odds of reporting difficulty deciding have increased 1.6-fold (increased by 60 percent), the odds to report inability to face problems have increased by 50 percent, feelings of constantly being under strain by 40 and feelings of worthlessness by 30 percent, while off of reporting a loss of confidence have been increased by 20 percent. Similar effects cannot be found for any of the previous years, which indicates that the Covid-19 pandemic indeed caused much higher mental problems.
Odds ratios are hard to understand however, as they cannot be equated with likelihood and can take large values if the underlying probabilities are small. For example, if depression increases from 1 to 2 percent of the population, this is a doubling, but the incidence in the population is still very low. In addition, the share of the population that never or always have a certain problem is dropped in fixed effects regressions. Because if someone never feels depressed or always feels depressed, then there is no change over time that the fixed effects can be based on. So the odds ratios only show increased odds of those people over time who are potentially vulnerable to a change of mental state. For example, if 20 percent of the population always claim to be depressed, while 20 percent of the population never do, only 60 percent of the population are open to changed states of depression. If the share of the population that claims to be depressed then increases from 20 to 25 percent, then odds are based on an increase of 5 out of 60 percentage points (who are potentially vulnerable), rather than based on 5 percent of the entire population, as some are simply not vulnerable to depression while others feel continuously depressed, regardless of what happens. Thus, the odds ratios above show the chance of a problem developing for those who are potentially vulnerable to this problem but do not have it continuously, regardless of what happens. They show, in other words, the chance of increased problems for those who can develop those problems.
Share of the population reporting higher than usual mental problems in the pandemic
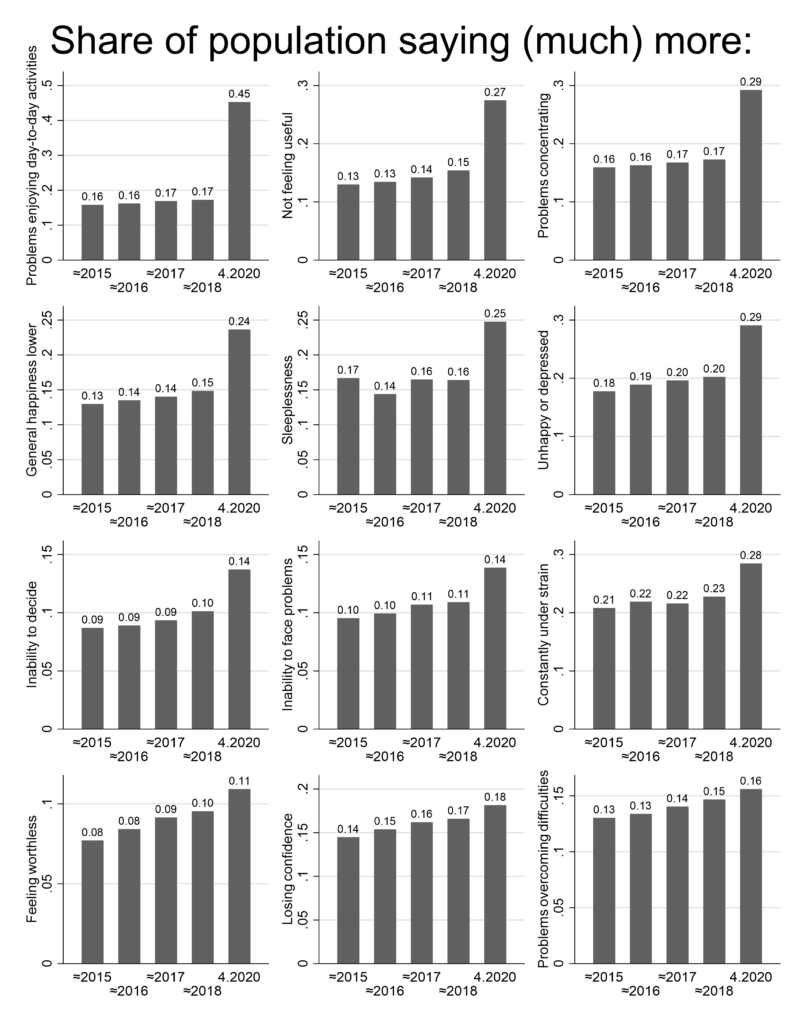
A more intuitively understandable (if less causal) picture emerges when simply looking at the share of the UK population that mentions having the mental problems above during the pandemic, relative to previous years. The following figure shows this. All data is weighted with each person’s annually re-weighted cross-sectional weight, so that it should be representative of the UK population in every year.

Figure 2: Share of the UK population reporting increased mental problems during Covid-19 pandemic (24.-30.4.2020) in the UK, compared to previous years (weighted with each person’s annually variable cross-sectional weight)
The graph shows how the share of the UK population reporting different problems has starkly increased during the Covid-19 pandemic, relative to previous years. Most notably, the share that reports problems enjoying day-to-day activities has almost tripled to close to half of the population. This however, can also be the case because there are much fewer day-to-day activities that can be enjoyed during a pandemic. However, problems feeling useful have also almost doubled, as well as problems concentrating. Almost a quarter of the population report lower happiness, compared to only about 15 percent in previous years. A quarter of the population reports more sleeplessness than usual, compared to only 16 percent in previous years. 29 percent report stronger feelings of unhappiness or depression, compared to only 20 percent previously. Other problems have also increased, but the increase is either not as stark (inability to decide, to face problems or feeling under strain) or can be explained as growing tension that increase with time, but not particularly during the pandemic.
Effect of the pandemic on overall well-being
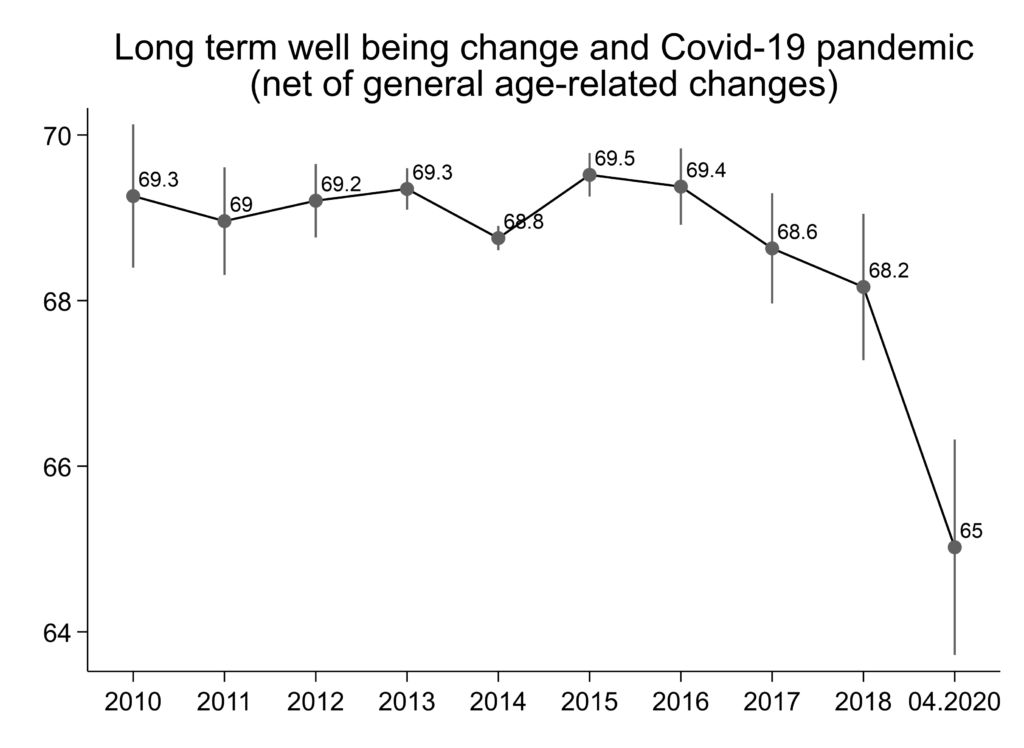
What do these increased mental problems do with overall well-being? The Understanding Society panel defines overall well-being as the addition of all of these variables. I have made the ensuing scale of well-being range from 0-100, with larger values indicating higher well-being. The following graph uses fixed effects regressions, which makes the graph show changes in well-being of the same person over time. I again control for age and age squared to make sure that any decline in life-satisfaction does not come about because people become older. Every person is weighted with her last weight, which should make results representative for the well-being trajectory of a typical person in the UK population.

Figure 3: Well-being (scale 0-100) during Covid-19 pandemic (24.-30.4.2020) in the UK, relative to previous years (fixed effects regression of the same person, adjusted for general changes in age and weighted with each person’s last individual weight)
The same average person, who in the UK in 2018 still had a well-being of 68.2 points (out of a possible of 100) experienced a decline by 3.2 points during the Covid-19 pandemic. For comparison purposes: this is the same effect as being unemployed (receiving unemployment-related benefits, or national insurance credits while not being in paid employment). Thus, to simplify, one can argue that the effect of the pandemic on mental well-being is as bad as the effect of becoming unemployed, one of the strongest known negative effects in the well-being literature.
Who is hit particularly hard?
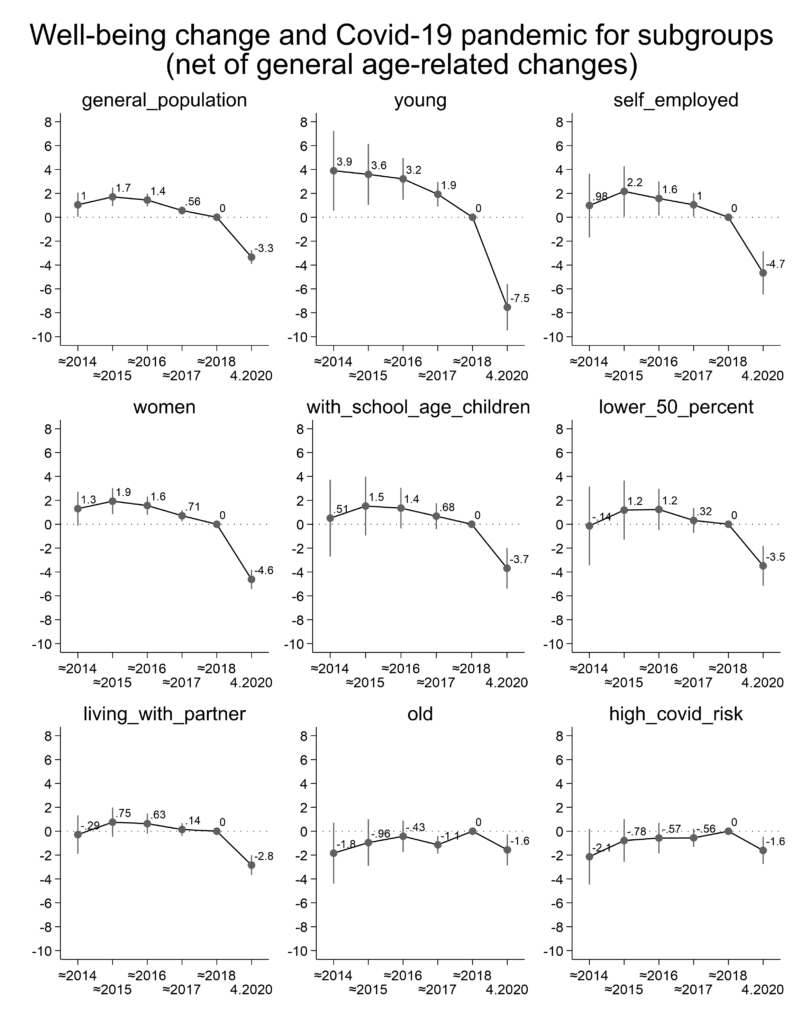
After having shown how the crisis impacted different aspects well-being and general well-being, I now show whether some parts of the population have been hit particularly hard. The following graphs first show how well-being has changed for the general population (as in the graph above) and then how different subgroups have been affected, starting with those who experienced the strongest decline from the pandemic, compared to those that experienced the weakest impact.

Figure 4: Well-being (scale 0-100) during Covid-19 pandemic (24.-30.4.2020) in the UK, relative to previous years (fixed effects regression of the same person, adjusted for general changes in age and weighted with each person’s last individual weight)
The steepest decline in well-being has been experienced by the young. The well-being of the same person below 30 was 7.5 points below the well-being of 2018. The second-most hit are the self-employed, who lost 4.7 well-being points. Next are women with 4.6 points. Note however that the average decline in the population is 3.3 points, so that e.g. the decline of those with school-aged children (3.7 points) is not much higher than the decline in the general population. Also, those in the poorer 50 percent of the income distribution have not suffered more (or less). Separate calculations (results not shown here) indicate that those who have lost money due to the pandemic (lower income in April 2020, relative to a baseline income of January 2020) have a decrease in life-satisfaction of 4.2 (compared to 2.5. for those who had an increase in income through the pandemic from Jan 2020 to April 2020). This suggests that whether people lost income due to the pandemic is not a strong predictor of who suffers from it. Those who live with a partner have not suffered particularly hard. Interestingly, those who are old (above 70) even seem to have suffered less from the pandemic than others. While having symptoms that could be the Corona-virus decreases well-being very much (minus 9 points, calculations not shown here), those who are particularly clinically vulnerable to Covid-19 (based on the definition of the Understanding Society) have suffered less than the general population.
It therefore seems that even though having Covid-19 symptoms is very damaging to well-being, it is not actual risk due to Covid-19 that decreases well-being in the general population, but rather the change to one’s previous life that the lockdown brought. One can imagine that the young had a particularly active lifestyle before the pandemic, which changed more due to the lockdown than the lifestyle of those who already had a less active lifestyle before the pandemic (the old and clinically vulnerable). Also, while self-employed and women seem a bit more hurt by the crisis, having children, being poor or living with a partner neither seems like an additional risk factor, nor does it work as a protective factor.
Different effects for different groups?
Why are some groups more affected by the lockdown than others? This can be answered by crossing the two types of analysis done so far, those that take different indicators and that look at different subgroups. However, I do not show all these graphs here, but rather describe their main results.
The decline of well-being of the young is mainly driven by them having twice as high odds as the general population to mention problems concentrating (odds of 4.9 versus 2018, compared to the general population’s odds of 2.4) during the pandemic. But, except that they do not constantly feel under strain more than the general population and that they do not mention problems overcoming difficulties more than the general population, the young are hit particularly hard in every respect. Thus, the young are hit by the pandemic more than others because they feel worse mentally in almost every respect and especially because they have more difficulty concentrating.
For the self-employed, the decrease in well-being is mainly driven by a decline in general happiness. The odds of saying that general happiness is lower during the pandemic is 3.5-times of what it is in 2018 among the self-employed, versus odds of only 2 in the general population. Also, the self-employed have odds of almost 2 to mention problems overcoming difficulties, compared to the general population’s odds of 1.1. This means that among the self-employed, decline in well-being is mainly driven by more problems overcoming difficulties and lower general happiness (but not more depression).
Women suffer a little more than men in almost every respect, which means that their generally higher decline in well-being is not due to some specific factor.
So what can we learn from this? Main results summed up
During the pandemic, the share of the population reporting unusually low happiness increased from 15 to 24 percent. Sleeplessness increased from 16 to 25 and feelings of unhappiness / depression from 20 to 29 percent of the population. Among those who are vulnerable to developing any of these problems at all, the odds to report lower general happiness, sleeplessness and feelings of unhappiness / depression were about doubled during the pandemic.The makes the impact of the pandemic on overall well-being about as negative for an individual as the effect of becoming unemployed.
However, the impact of the pandemic is not a social-inequality issue and does not seem to be strongly related to a loss of income. The pandemic was hardly worse for those who earn less than most or who lost income through the pandemic. However, the pandemic hit the young twice as hard as the general population, while those who are old or actually have a clinically high risk from Covid-19 fared better than the general population. This suggests that the lockdown had the most negative impact on those who had the most active lifestyle before the pandemic (the young), rather than those who were actually most at risk from Covid-19 (the old and vulnerable). The problem with the lockdown therefore does not seem to be that Covid-19 was around, but that people had to change their lifestyles.
That the lockdown had clear negative effects shows that while it may be important to stop the spread of the virus to contain the damage it causes, the lockdown itself also causes damage, measurable as a decline in well-being, particularly for the young. For example, while having symptoms that could be the Coronavirus decreases well-being by about 9 points, the lockdown itself seems to have impacted the young almost as much (decline of about 7 points).
Please keep in mind: Preliminary nature of findings
This blog entry will be updated and is based on the first available data. I have started calculating effect sizes on the 29th of May, the day the data came out, to make results available to the interested public as soon as possible. However, this means that a lengthy process of data analysis, which usually takes months, was condensed into a short time frame. This means that I am likely to have made some mistakes. In the interest of openness and because this article could not undergo a peer review (even though I thank Isabel Habicht for checking my do-file, all remaining mistakes are mine), I have provided the code with which I have calculated all effects on this website and would be glad for any suggestions as to what can be improved.
Data used
The data for the Covid-19 survey is: University of Essex, Institute for Social and Economic Research. (2020). Understanding Society: COVID-19 Study, 2020. [data collection]. 1st Edition. UK Data Service. SN: 8644, 10.5255/UKDA-SN-8644-1.
The data for prior waves is: University of Essex, Institute for Social and Economic Research. (2020). Understanding Society: Waves 1-9, 2009-2018 and Harmonised BHPS: Waves 1-18, 1991-2009. [data collection]. 12th Edition. UK Data Service. SN: 6614, http://doi.org/10.5255/UKDA-SN-6614-13
You can download the code that I have used by clicking here: Martin Schröder 05.06.2020 – Stata do file for calculation blog post
The regressions that I have used are mainly adapted from my most recent book:

